Request a demo
Tell us about yourself, and we'll be in touch right away.

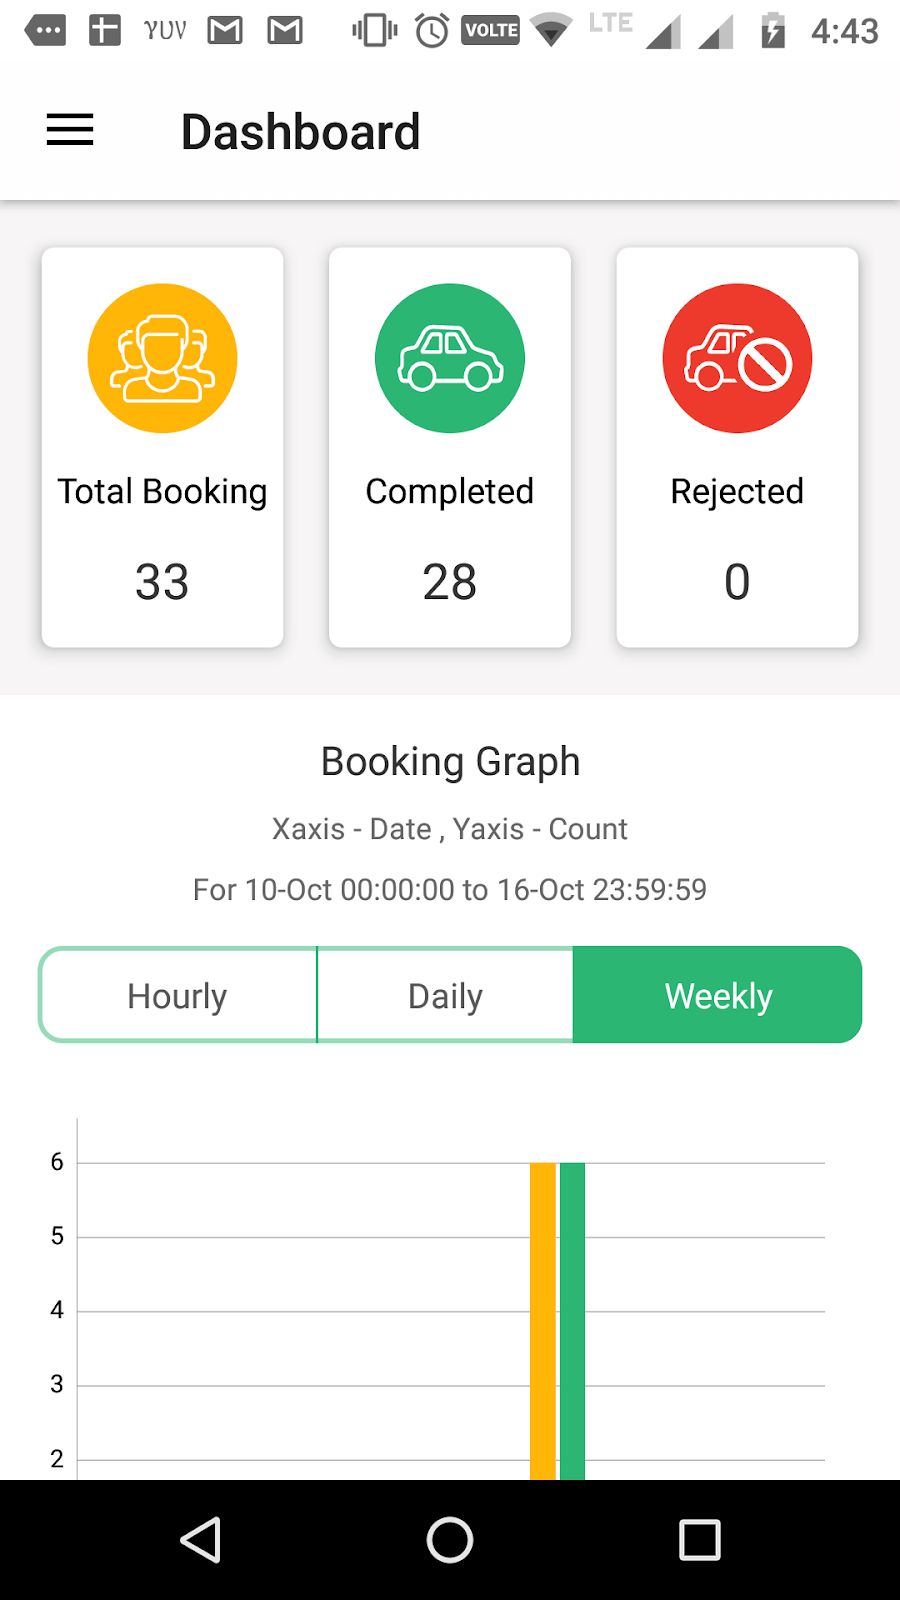
Dashboard provides the statistical information on all key factors including the total number of bookings and the completed and rejected rides.
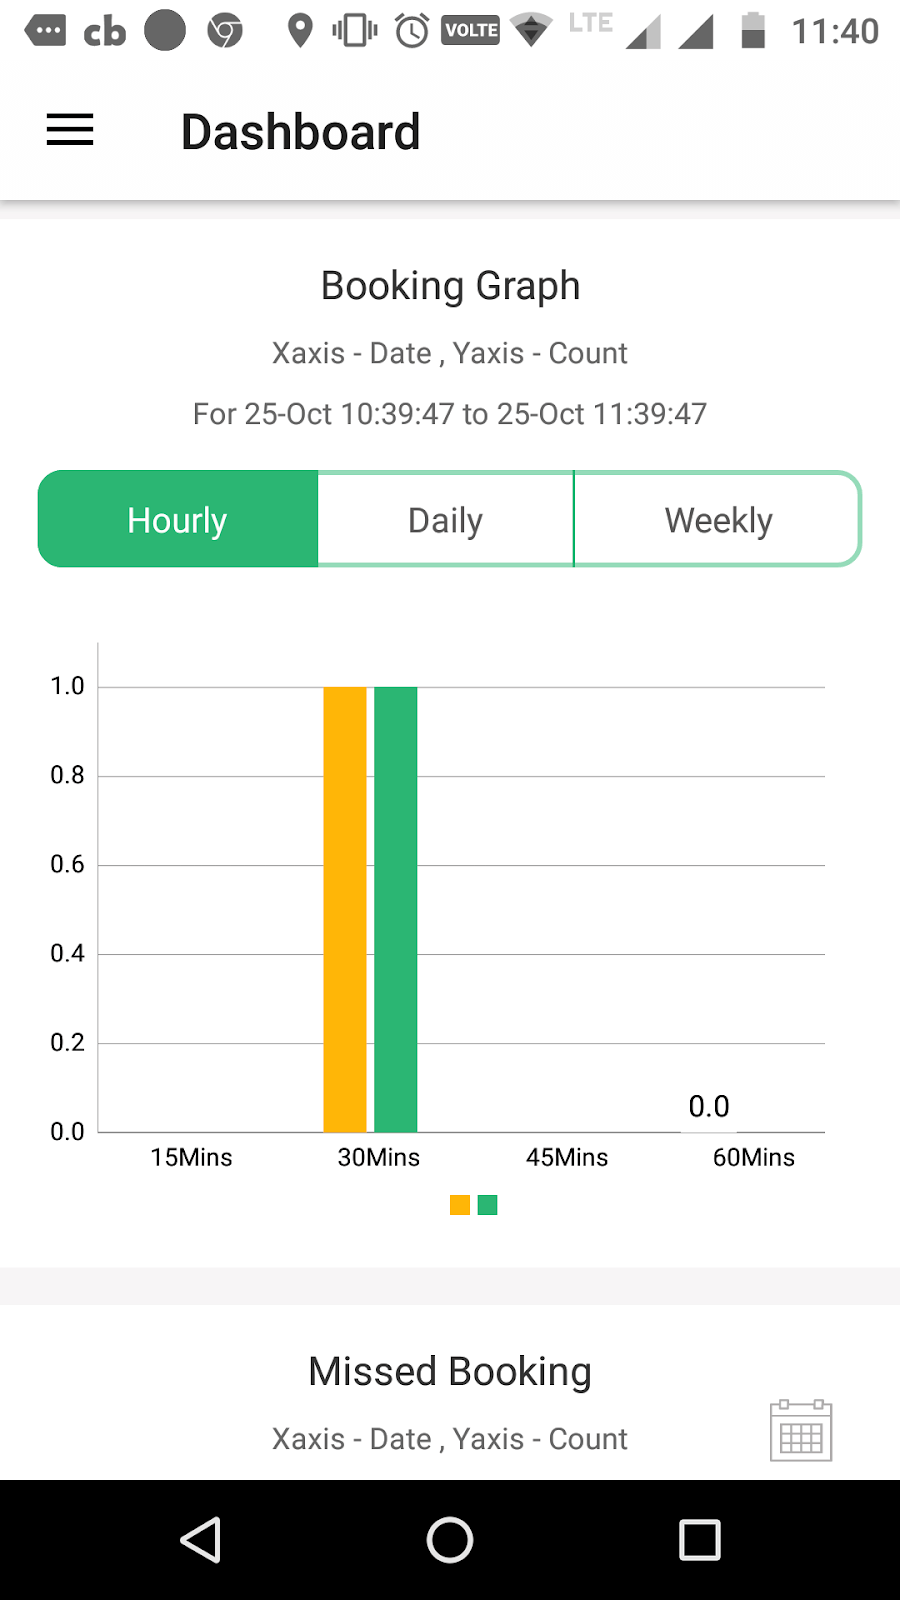
The booking graph in the dashboard presents an overview of the total number of bookings for the last one hour or last 24 hours or last 7 days (based on whether ‘hourly’, ‘daily’ or ‘weekly’ is selected).
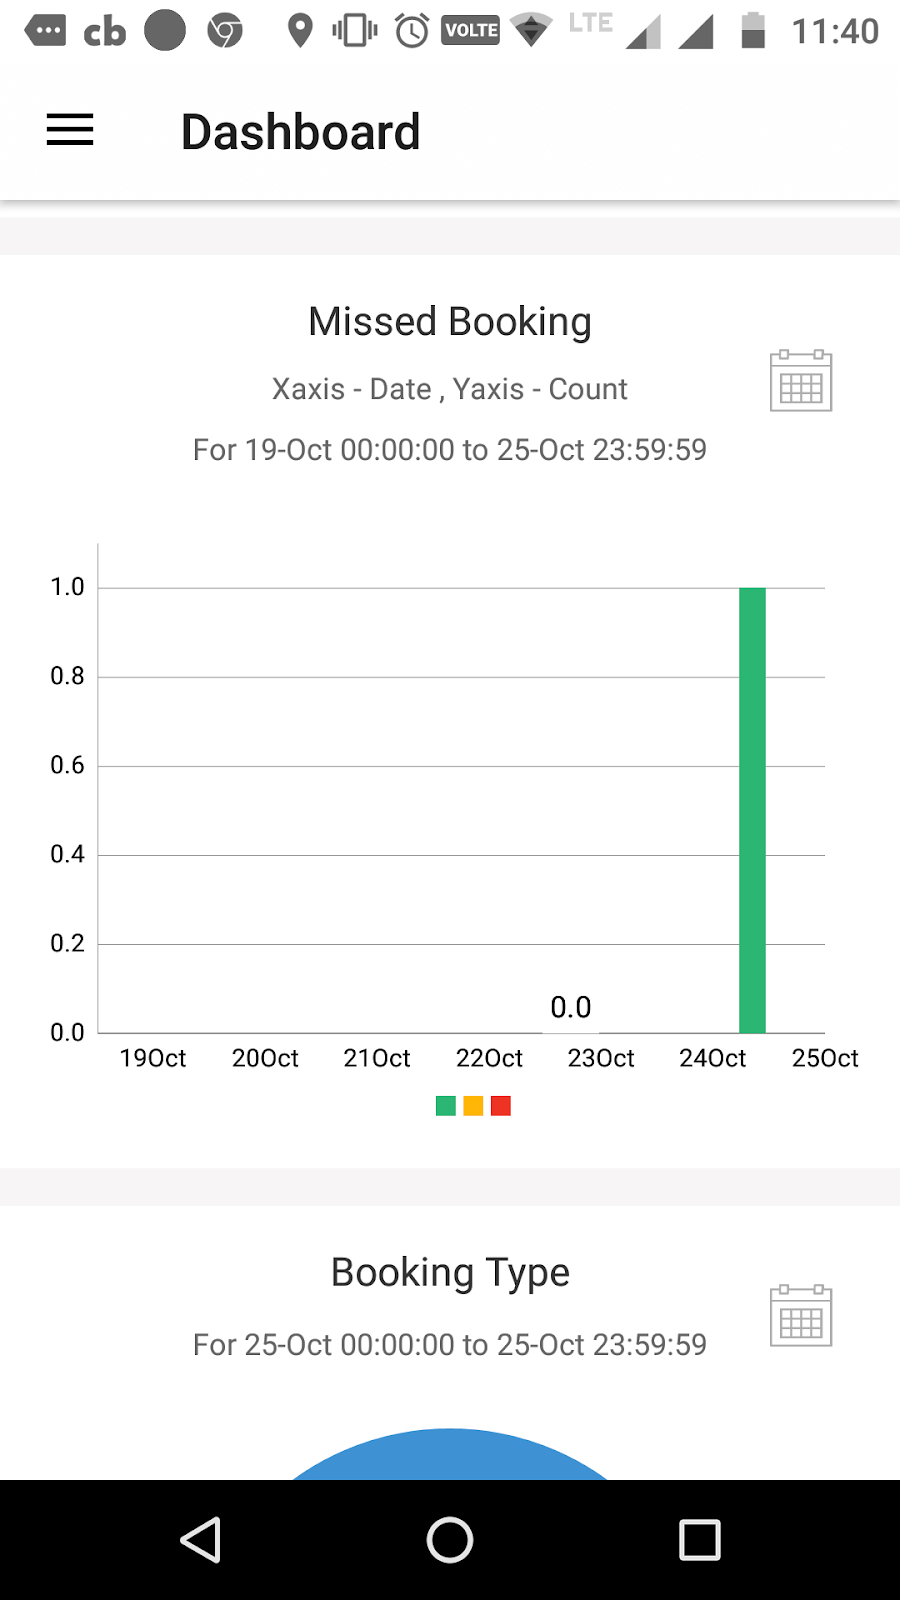
The dashboard displays the count of all the rides missed due to rides being rejected by the driver, cancelled by the rider or due to unavailability of a driver. The details can be filtered selecting the from and to dates from the calendar.
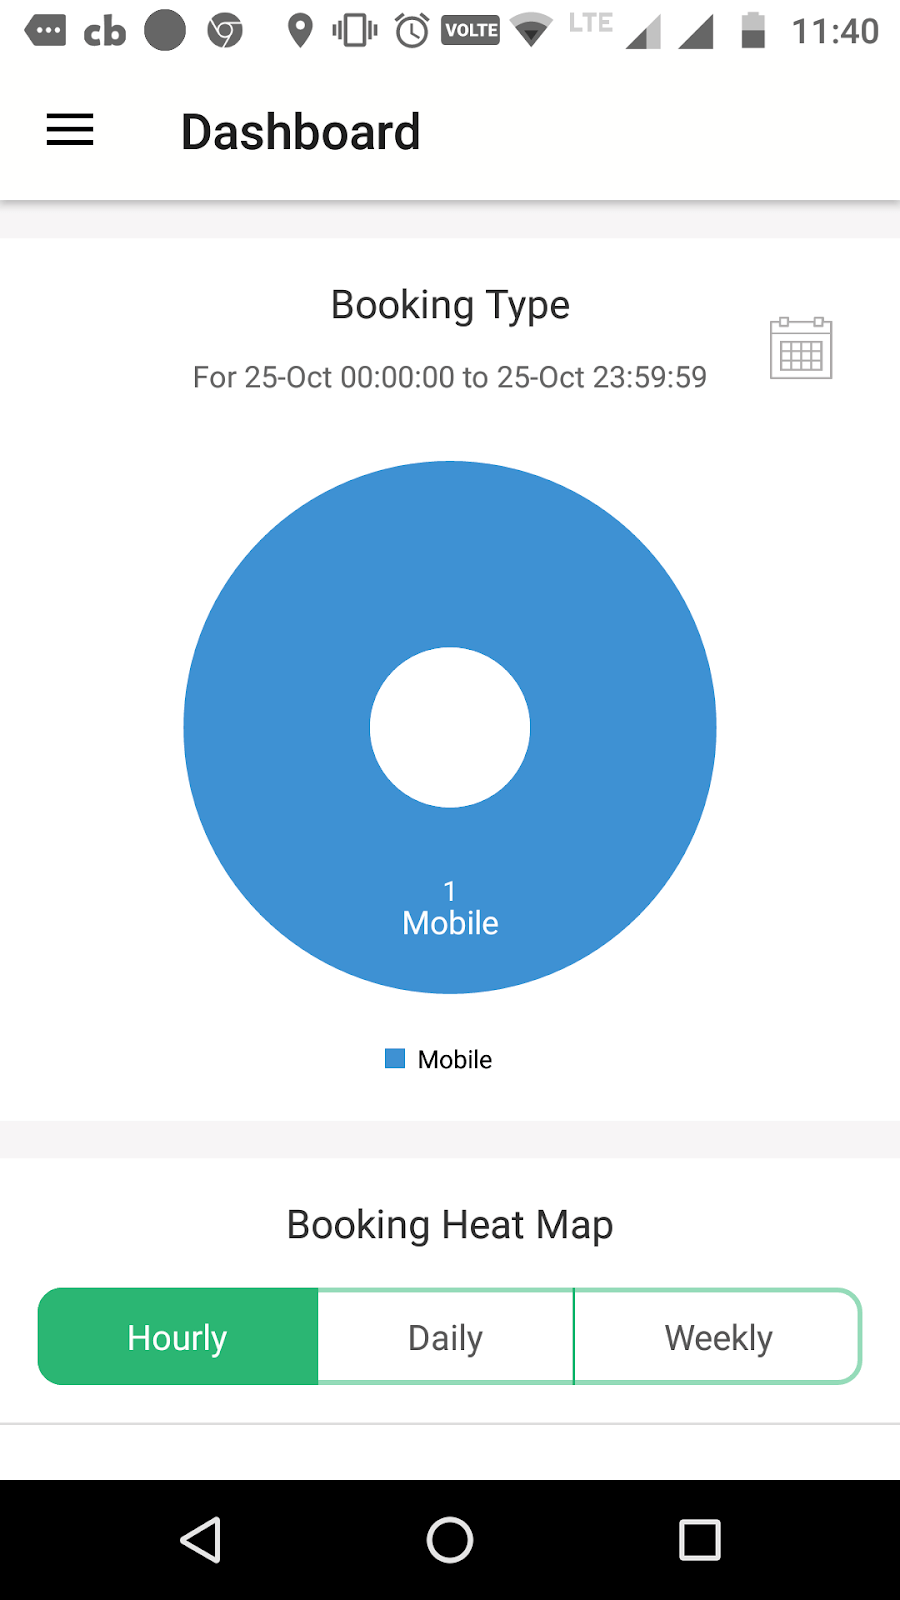
Bookings done via website, mobile app, street pickups and call centers are displayed individually. The filter option can be used to get the data for a specific interval of time.
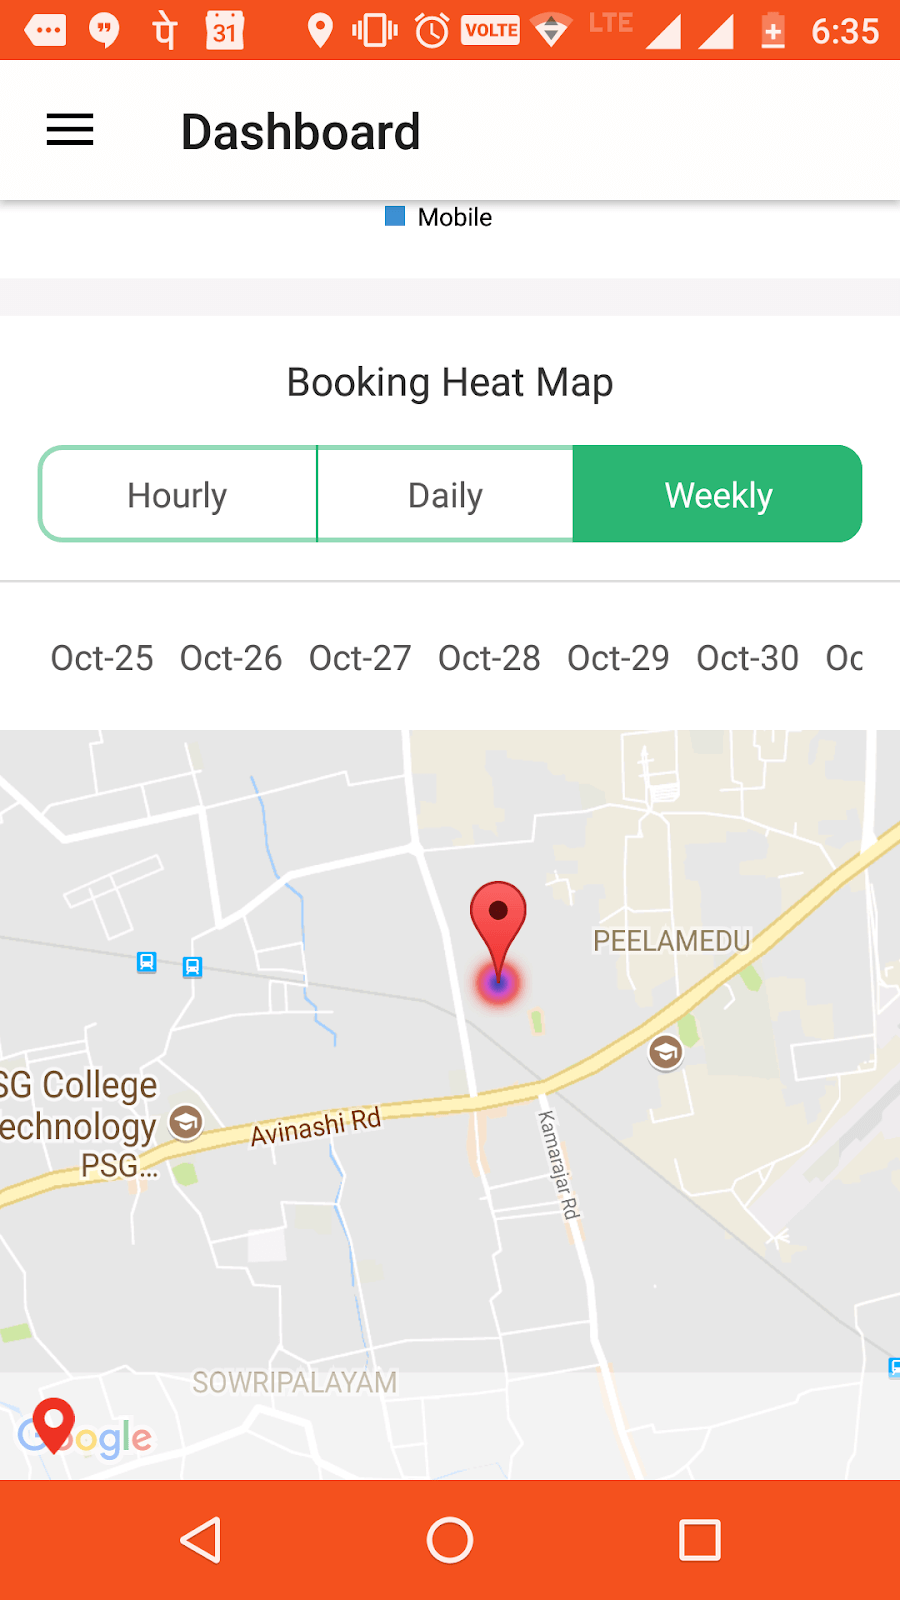
The booking heat map indicates the area (based on the location selected by the dispatcher) with the highest booking rate. Based on the maximum and minimum bookings, the particular locations will be highlighted in dark and light colours in the map, respectively.