Request a demo
Tell us about yourself, and we'll be in touch right away.

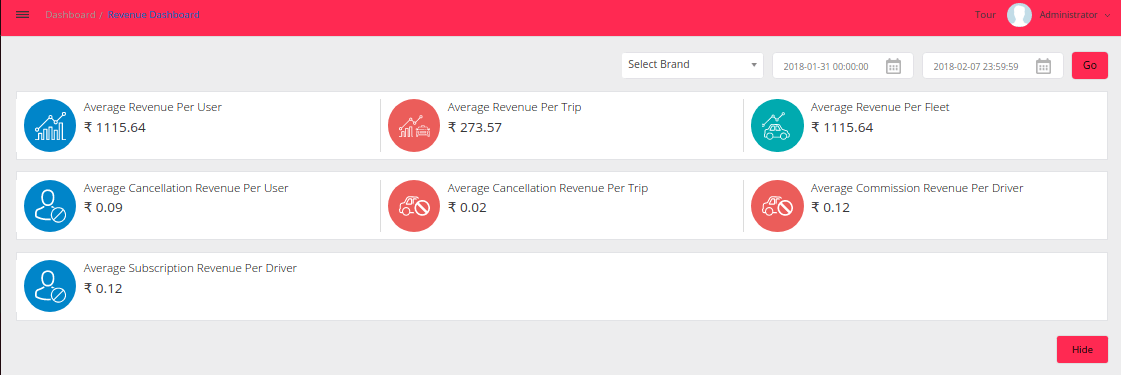
The dashboard manifests the average revenue received per user, per trip and per fleet. The average revenue received through cancellation of rides are also provided here.
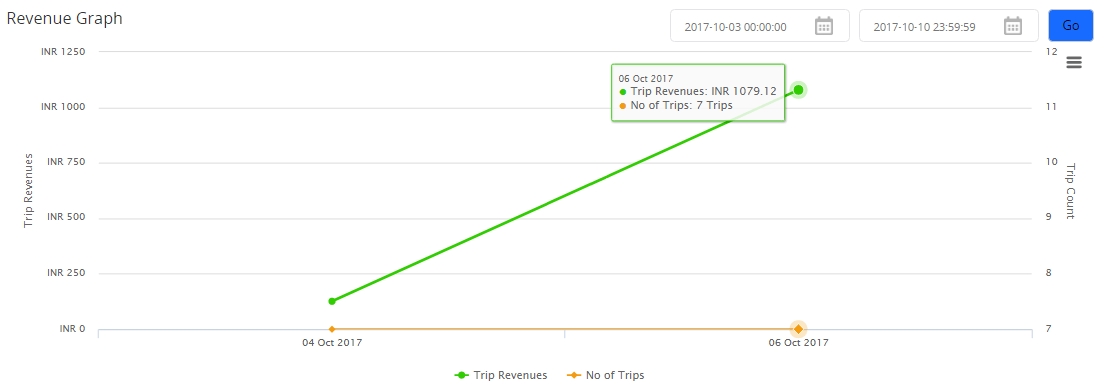
Revenue graph shows the number of rides and the respective earnings for the month. The filter option allows to view the details of the selected dates.
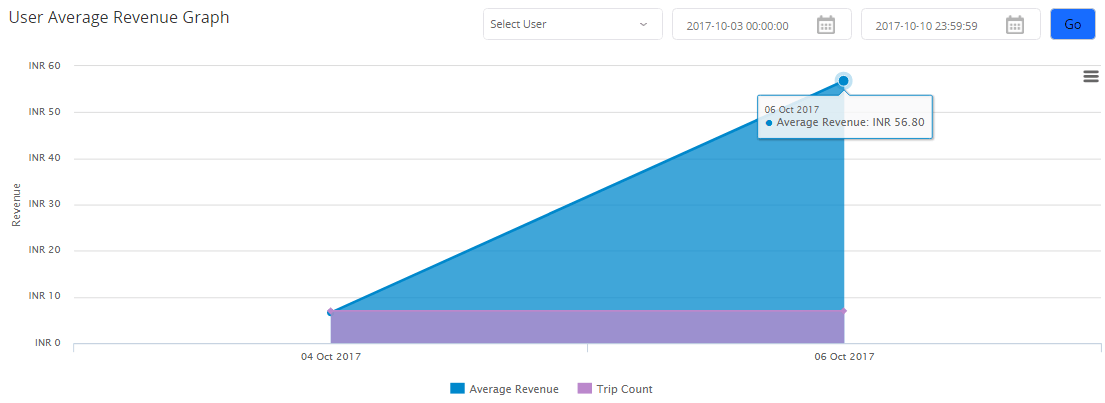
The graph renders the average revenue received per user with the trip count.
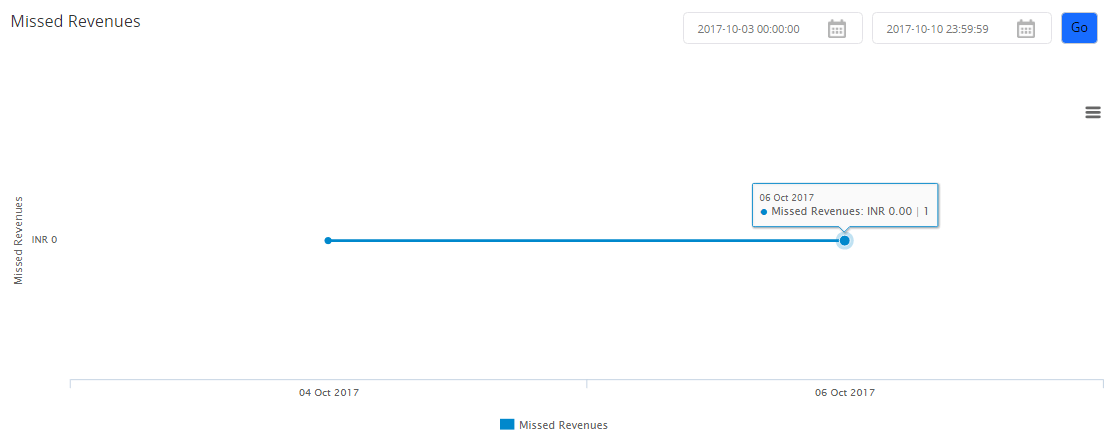
The revenue missed from the rides either rejected by driver or cancelled by passenger are represented in the graph below.
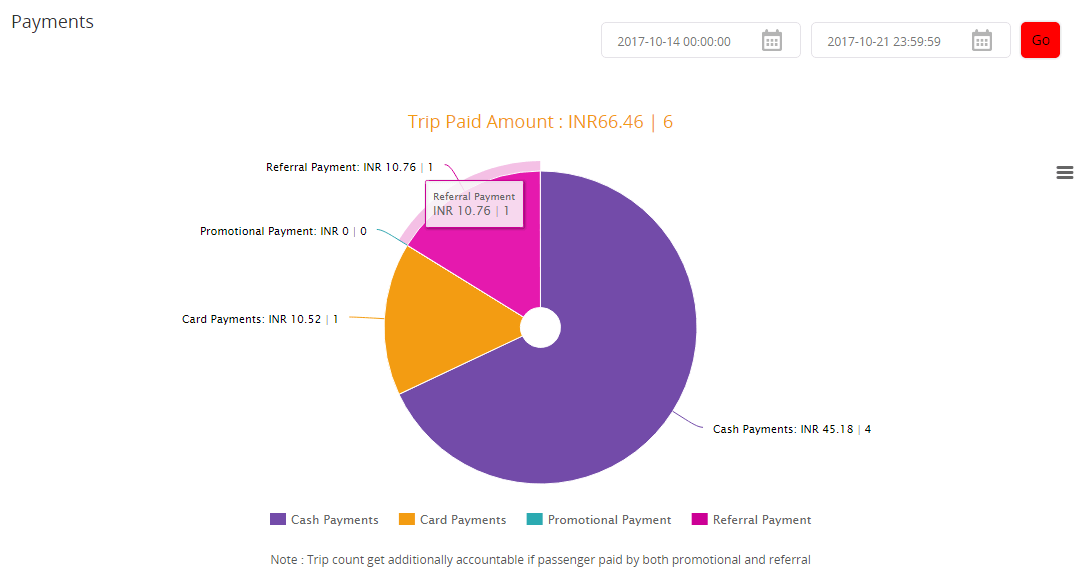
Revenue generated from payments received through referral programs, promotions, card and by cash is indicated here. The filter option can be used to get the data on a particular date and time.
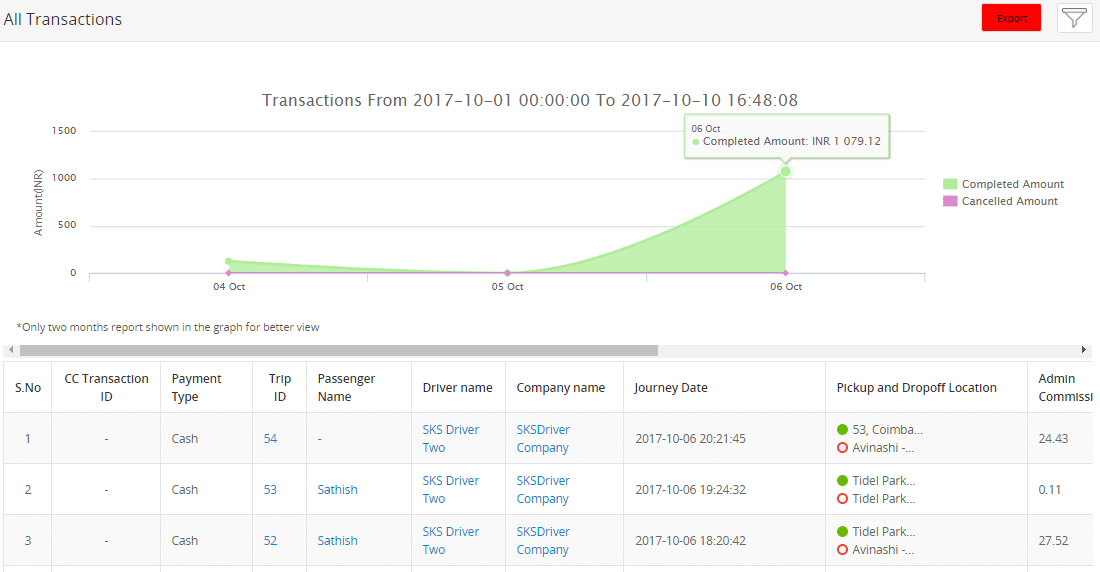
A report of all transactions is listed here with the ride details including pickup-drop off locations, passenger name, date, transaction ID and so forth.
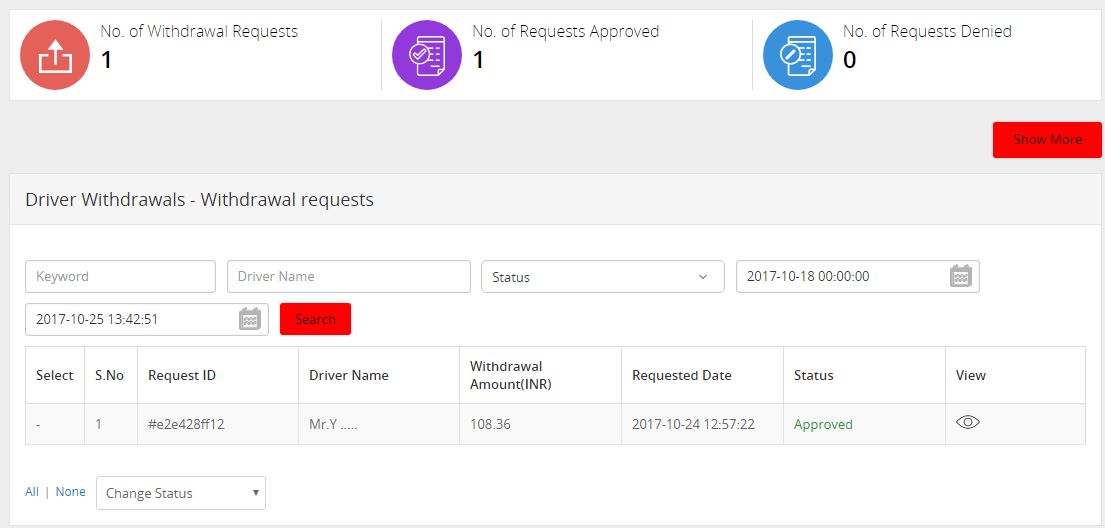
The withdrawal requests by the company sent to the admin to withdraw amount from the wallet are tabulated with the amount and status of each request. Company admin can view the total number of withdrawal requests, requests denied, requests approved and requests in pending. Notifications are sent to the admin/company for every driver withdrawal request. Drivers are also notified on requests being either approved or rejected by the admin/company.
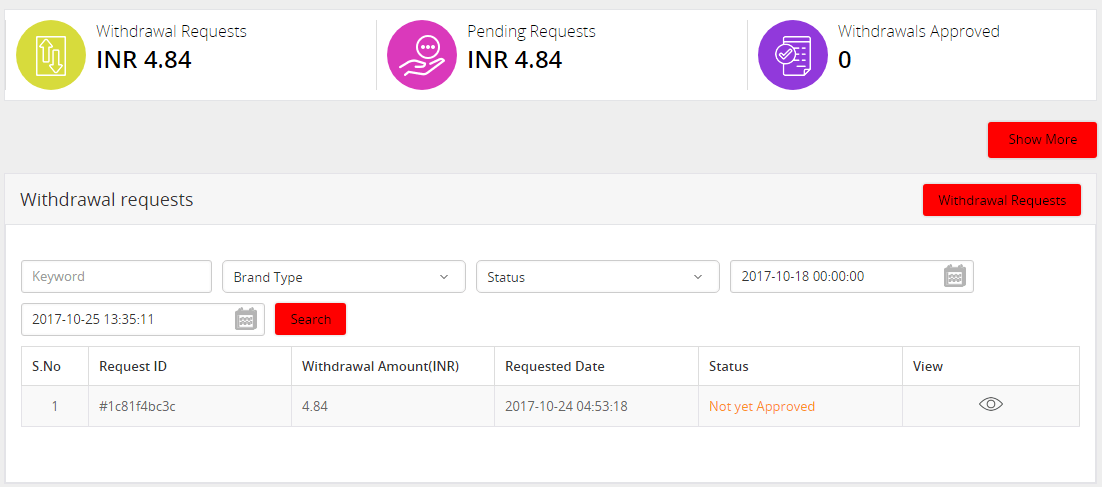
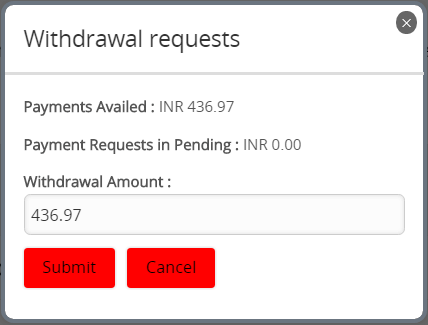
On clicking Withdrawal requests, company can send request to the Admin by indicating the amount required to be withdrawn.
The withdrawal requests by drivers are tabulated with the total number of requests placed, approved, denied and pending with all the transaction details, for each driver.