Request a demo
Tell us about yourself, and we'll be in touch right away.

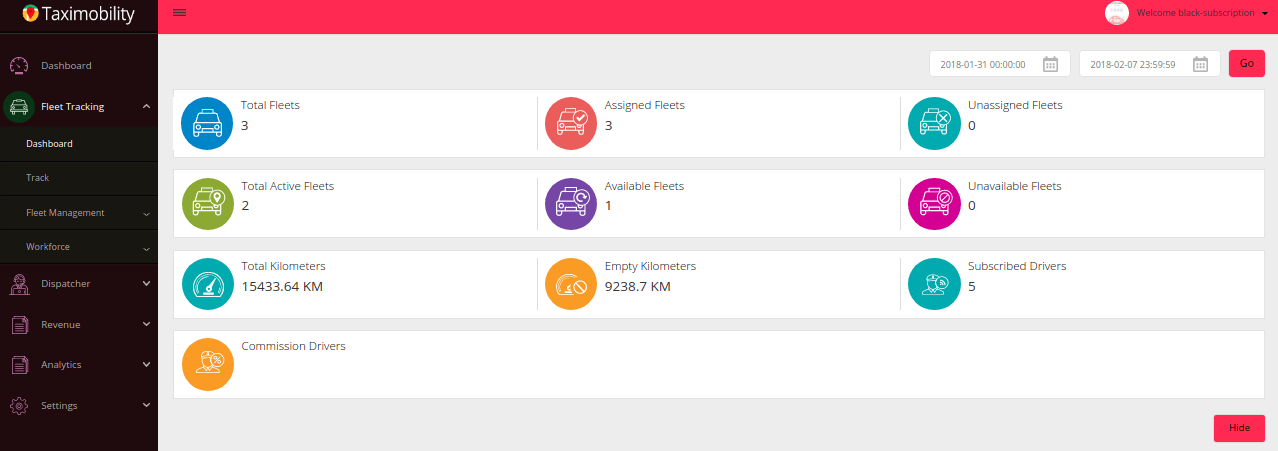
Dashboard provides statistical information on all key factors including payments, commission to admin, number of new users, rides, active passengers, cancelled rides, driver recharge amount and so forth, listed most precisely and accurately. All charts and graphs are provided with links to a more elaborate report of the information available in the particular chart or graph.
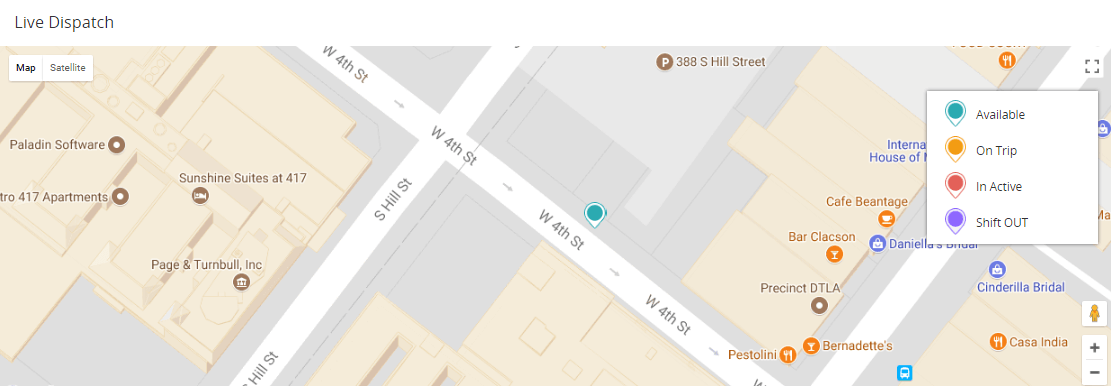
The Map indicates the location and status of drivers as available, on trip, active or shift out with different pointer icons. The Admin can view live tracking with vehicle movements.
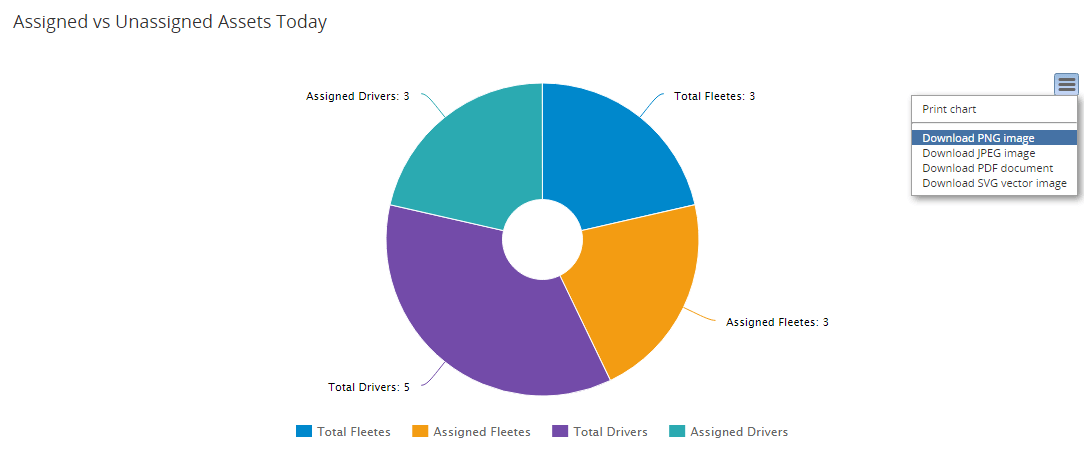
The graph displays information on the total number of fleets and drivers, and distinctively the count of assigned fleets and drivers.
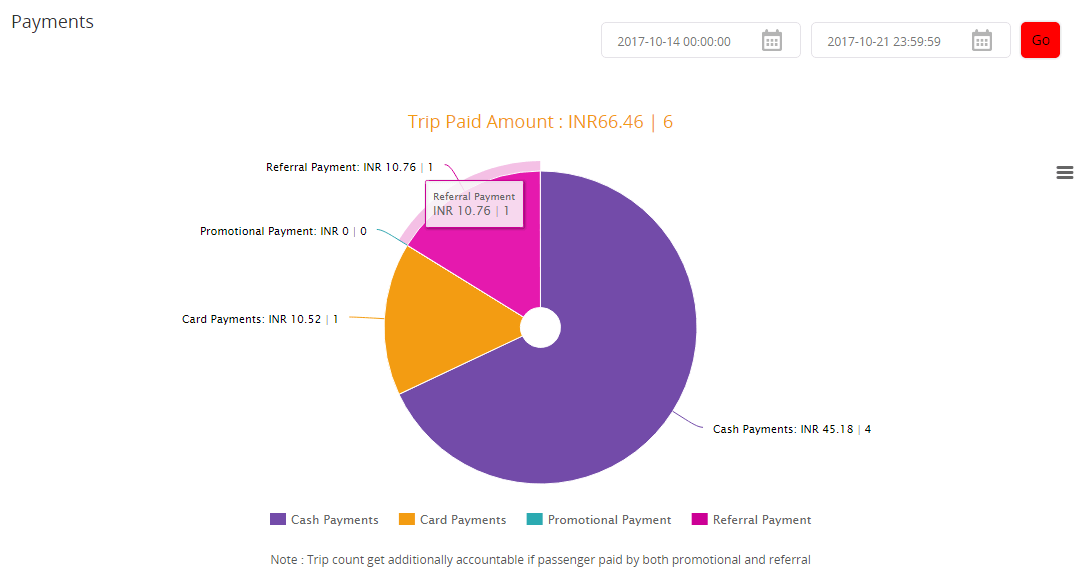
All transactions made after the completion of rides are segregated indicating the amount as payments by trip, card, cash, and as payments
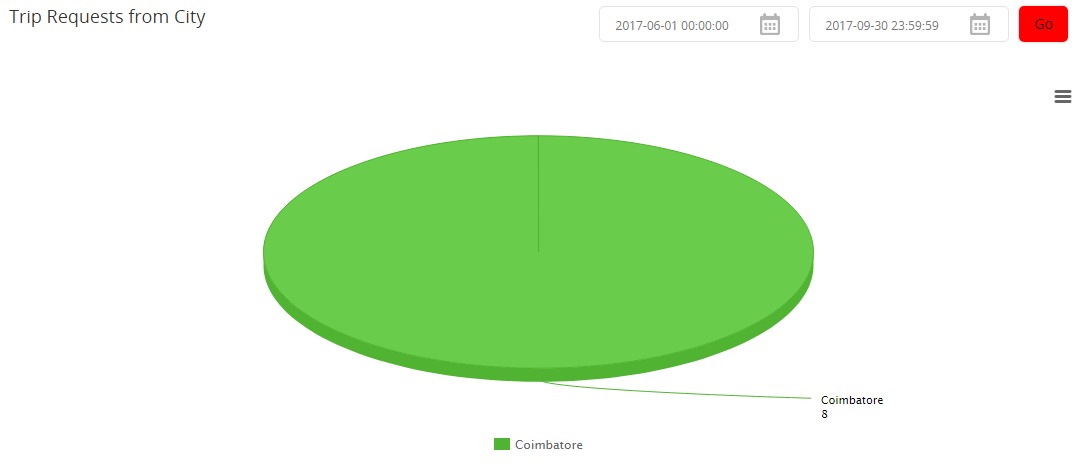
The passenger requests from different cities are represented by a pie chart depending on the origin of passenger request. The details can be filtered using date, time or brand and can be exported in various file formats.
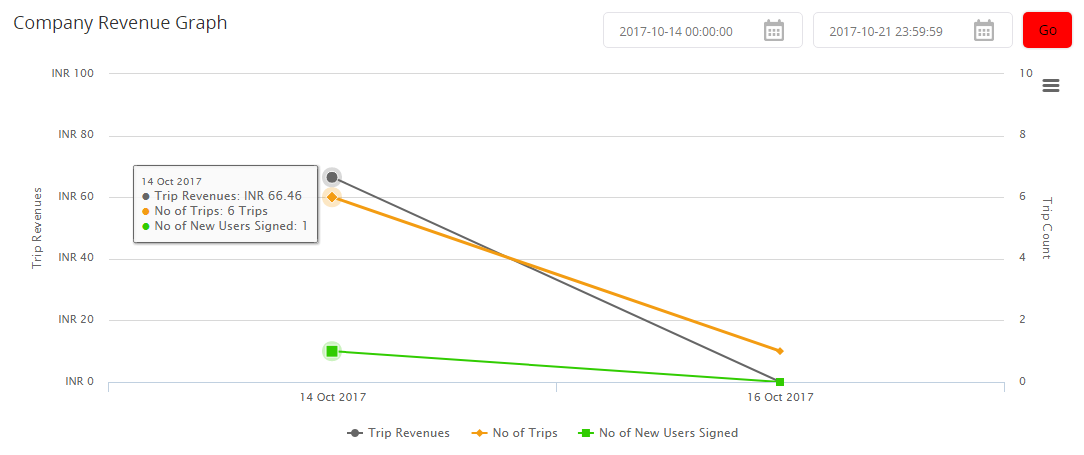
The graph indicates the total revenue generated for the month displaying the number of rides, new users registered and the income generated for each day.
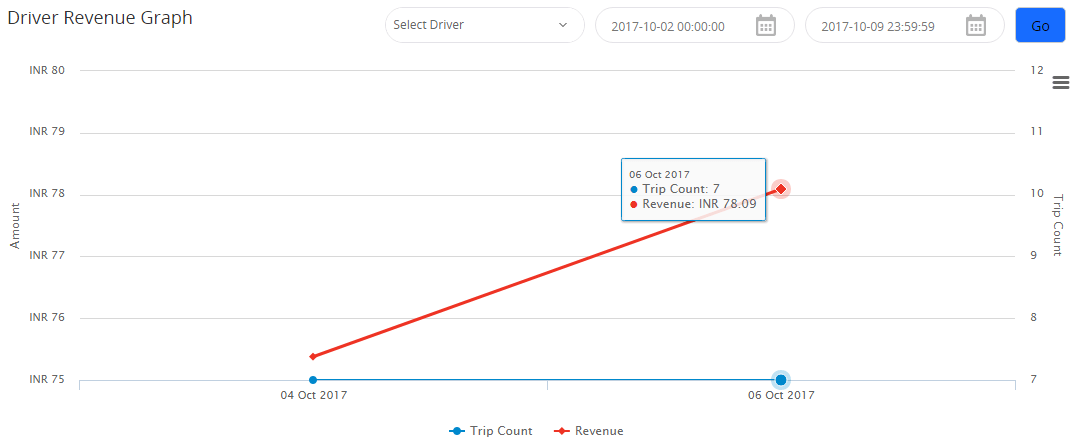
The revenue generated per driver for the month is displayed with the trip count and income for each day. The filter option helps to view the revenue details per driver by selecting the name from the dropdown and the from and to dates in the calendar.