Request a demo
Tell us about yourself, and we'll be in touch right away.

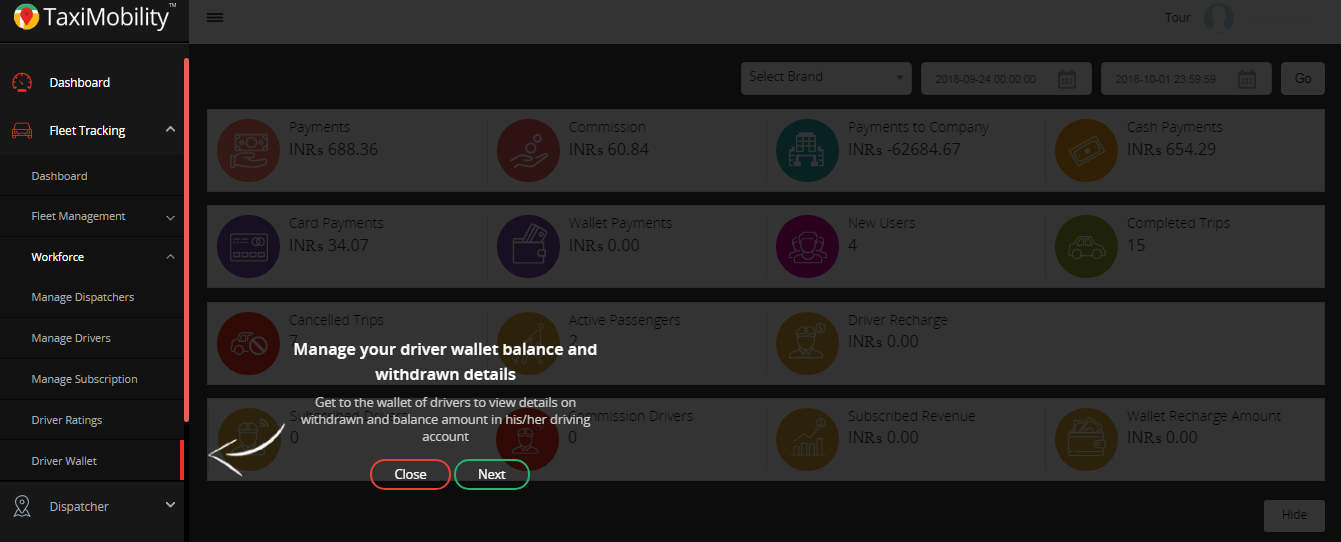
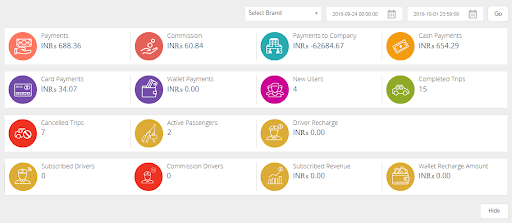
With a bird's eye view of essential information, the dashboard presents everything there is to know in a glance. From cab availability to passengers in-line, Dashboard has it all. It contains statistical information on all key factors including the payments, commission to admin, number of new users, rides, active passengers, canceled rides, driver recharge amount, and so forth, listed most precisely and accurately. The search option is enabled in all drop-down lists for easy search. All charts and graphs are provided with links to a more elabor ate report of the information available in the particular chart or graph.
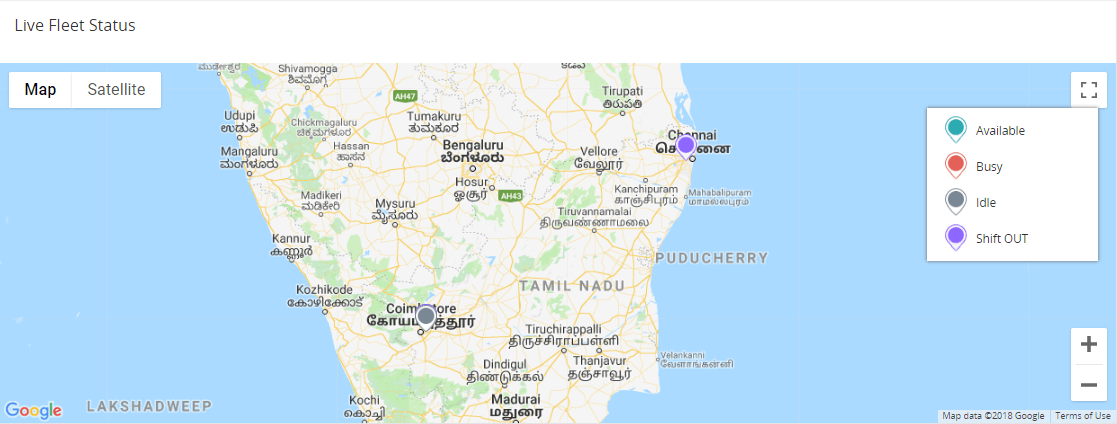
The map indicates the location and status of drivers as available, on trip, active, or shift out with different pointer icons. The admin can view live tracking with vehicle movements.
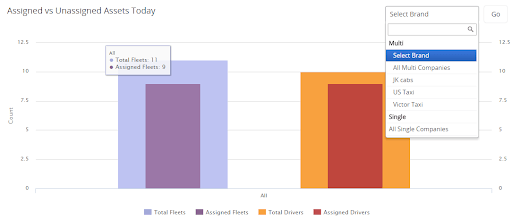
The graph displays information on the total number of fleets and drivers, and distinctively the count of assigned fleets and drivers for the selected brand.
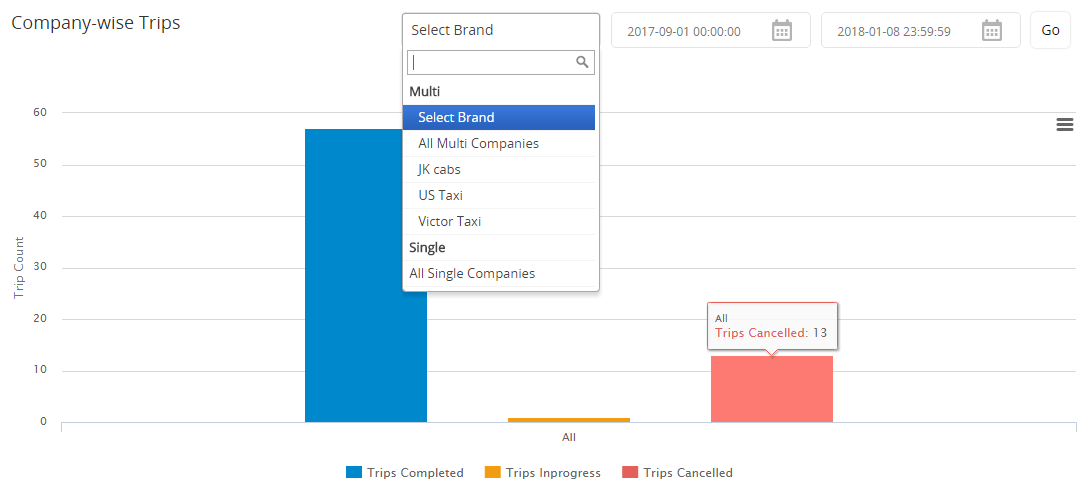
The company-wise trip details present the number of rides completed, in progress, and canceled for each company, date, and time selected using the filter. The admin can print or download the data in any of the given formats.
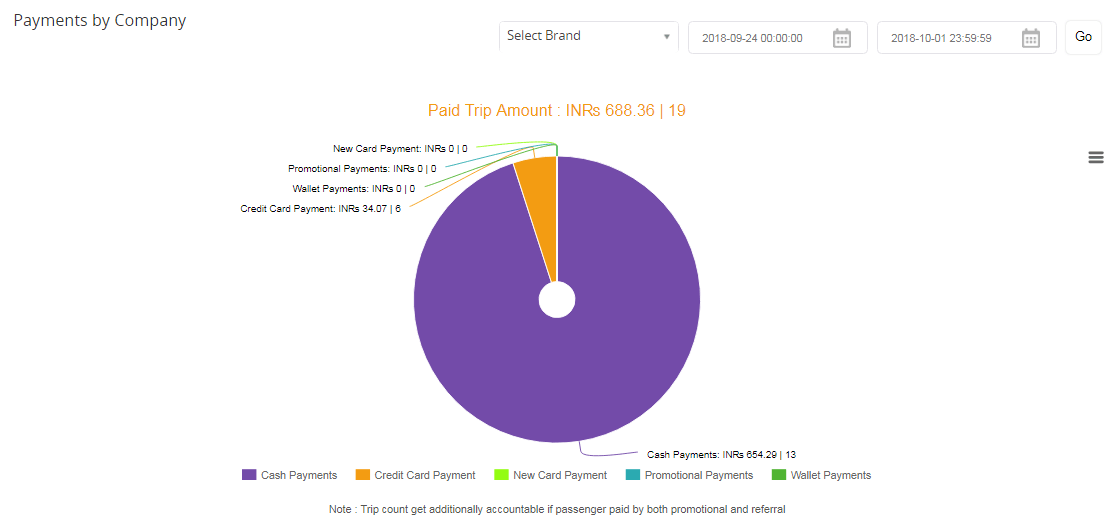
All transactions made after the rides are segregated indicating the amount as payments by trip, card, cash, and as payments through referral and promotional programs. These can be easily filtered searching by date and time, or brand.
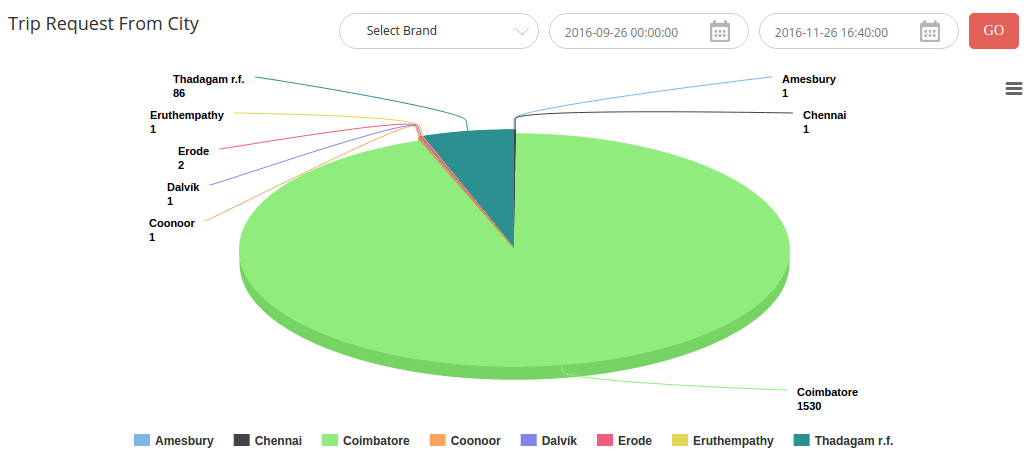
The passenger requests from different cities are represented by a pie chart depending on the origin of passenger request. The details can be filtered using date, time, or brand and can be exported in various file formats.
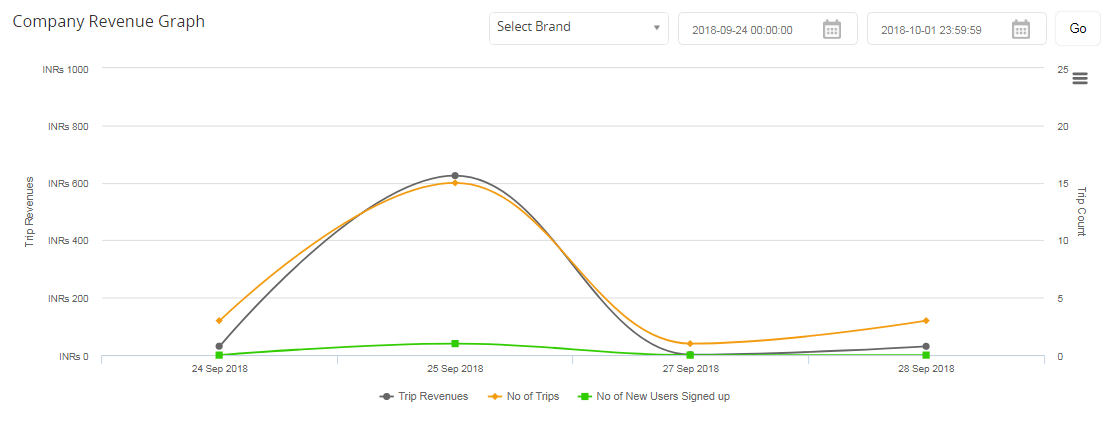
The graph indicates the total revenue generated for the month displaying the number of rides, new users registered, and the income generated for each day.
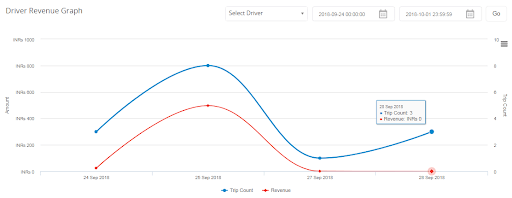
The revenue generated per driver for the month is displayed with the trip count and income for each day. The filter option helps to view the revenue details per driver by selecting the name from the drop-down and the from and to dates in the calendar.
Tour option is available in the header that can also be enabled or disabled at the back end. Click on it, which gives information about each sidebar menu.